How to read currency exchange charts step by step for beginners
Learning how to read currency exchange charts is one of the first and most important skills for forex traders. Charts transform raw price data into a visual story of market behavior, helping traders understand trends, momentum, and potential trade opportunities. With the right approach, even beginners can read charts with clarity and confidence.
1. What currency exchange charts show
Currency exchange charts display how the price of a currency pair moves over time. The vertical axis represents price, while the horizontal axis represents time. Each chart reflects the ongoing interaction between buyers and sellers.
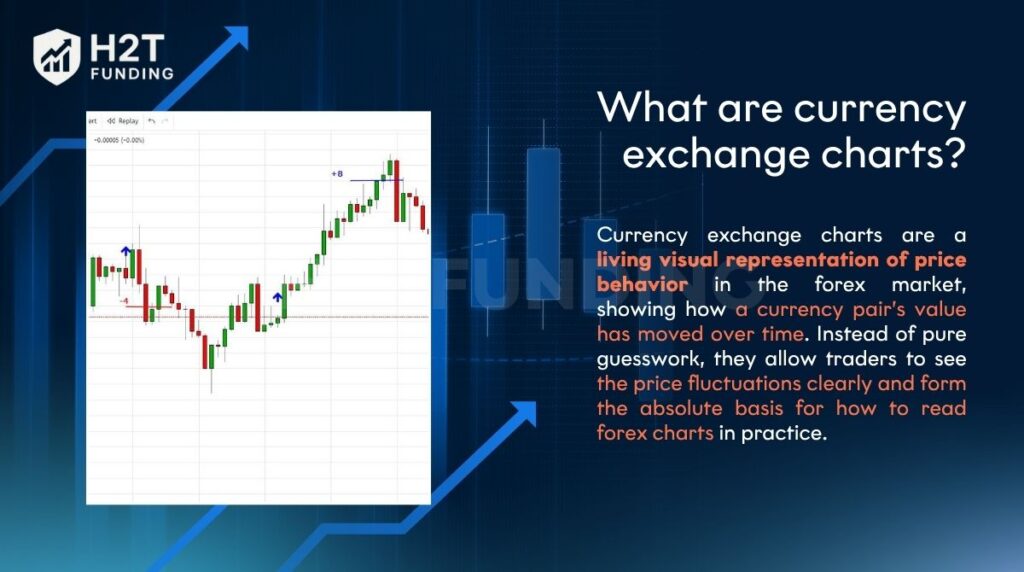 |
| Currency exchange charts are a living visual representation of price behavior in the forex market |
By reading these movements correctly, traders can understand whether the market is trending, ranging, or becoming volatile, which forms the basis for all technical analysis.
2. Main chart types beginners should know
Forex traders commonly use three chart types:
Line charts, which connect closing prices and show the overall direction
Bar charts, which display open, high, low, and close prices
Candlestick charts, which visually highlight price behavior and market psychology
Among these, candlestick charts are the most beginner-friendly because they present information clearly and reveal patterns quickly.
3. How to read candlestick charts
Each candlestick represents one time period and contains four key prices: open, close, high, and low. The candle body shows the distance between open and close, while wicks display extremes.
A bullish candle indicates buyers were stronger during that period, while a bearish candle shows selling pressure. Reading sequences of candles helps traders identify momentum and possible reversals.
4. Identifying trends on forex charts
Trends show the dominant direction of the market:
An uptrend forms higher highs and higher lows
A downtrend forms lower highs and lower lows
A sideways market moves within a range
Drawing simple trendlines helps traders stay aligned with market direction instead of trading against it.
5. Using support and resistance levels
Support and resistance are key price zones where the market often reacts. Support acts as a floor where price tends to bounce, while resistance acts as a ceiling where price struggles to rise.
These levels help traders plan entries, exits, and stop-loss placement more effectively.
6. Combining charts with basic indicators
Charts become more powerful when combined with simple indicators such as moving averages or RSI. Indicators confirm what price action suggests and help filter out weak trade signals.
For beginners, using just one or two indicators alongside clean charts is usually more effective than overloading the screen.
7. Why practice is essential for chart reading
Reading charts is a skill that improves with repetition. Using a demo account allows traders to practice identifying patterns, trends, and levels without risking capital.
Keeping a simple trading journal further reinforces learning by helping traders review decisions and outcomes.
Conclusion
Understanding how to read currency exchange charts gives traders clarity in a fast-moving forex market. By focusing on candlestick behavior, trends, and key price levels, beginners can turn charts into practical decision-making tools.
For a complete beginner-friendly breakdown, read the full guide here:
👉 https://h2tfunding.com/how-to-read-currency-exchange-charts/
#funding
#h2tfunding
#nganpham
#finance
#howtoreadcurrencyexchangecharts
#nganphamh2t


Nhận xét
Đăng nhận xét